Got Data? Now What?

Think you might want to read this book?
Are you leading a school and know that data should be a more integral part of the decision-making process? If so, Got Data? Now What? may just scratch that itch. You will be warned of the pitfalls, walked through the protocols, and told step-by-step what to do to maximize your time and energy while turning data into decisions. It’s a quick read for those familiar with data analysis and only a slighter tougher one for those who aren’t. A must-read for anyone who has ever been frustrated with education's attempt to incorporate data in a meaningful way.
What Would Socrates Ask?
What if all meetings had a pre-planned purpose, agenda, and protocols?
How do we ensure all voices are heard before decisions are made?
What are the areas in education where data should determine policies?
What if all meetings used protocols to ensure an even distribution of ideas?
Research
School teams have to battle three dilemmas when working with data: committee without community, time without tools, and data without deliberation.
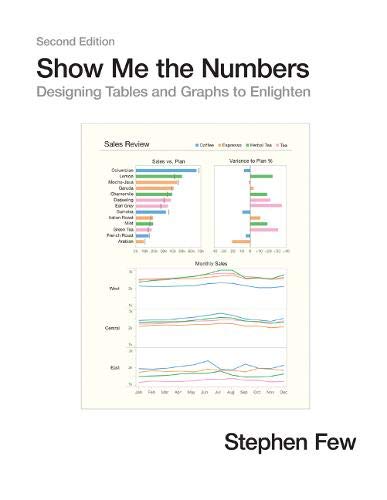
Four effective methods of displaying data so that it facilitates discussion: 1- filter out what isn’t relevant, 2- sort the data to see it in order of magnitude, 3- provide high-level (big picture) and low-level (detailed) views of the data, and 4- offer varying views and perspectives of the data using different display types.
There is a powerful connection between pausing and the quality of thinking during work sessions. Conversational pace affects both the emotional and intellectual climate for group members. Fast-paced interactions may exclude more introspective members.
Concepts
“Purposeful uncertainty”- the guiding mindset of the exploring and discovering phase of data analysis.
“Intellectual hang time”- the systematic avoidance of rushing to closure so fresh perspectives and approaches to problems can be explored.
“Disaggregation”- breaking up a large data set so teams can analyze it more clearly and precisely.
“Triangulation”- requires multiple views, or multiple sources, to create a more complete assessment of the issue being studied.
“Observational data”- data that is clearly visible (e.g., Checklists, archives, etc.).
“Perceptual data”- data regarding how people feel (e.g., surveying them about opinions).
It is critically important to:
Structure the workspace
Provide time to orient to the data displays before talking
Apply protocols to balance participation
Establish a public recording protocol.
3 separate modes are essential when working with data: dialogue, discussion, and decision making.
When looking at the data is it important to think of multiple theories of causation and when planning action to develop multiple theories of solution.
An idea is worth pursuing if the issue:
occurs with frequency
across multiple grade level/student groups/academic disciplines
consumes high levels of energy, time, and resources.
“Belief blindness”- when the scope of a discussion is narrowed by seeing only what one expects to see or data is only seen through the lens of supporting their beliefs.
Elements of an effective plan for looking at data:
Clear outcomes
Sequence and timelines
Monitoring systems,
Roles and responsibilities.
Quotes from the author
… when teachers work in isolation without the grounding that data or collegial perspectives provide, they tend to rely on habit and make decisions based on anecdotal evidence and intuition.
Although the power of data-driven collaboration is well researched, it is often difficult to establish as a norm for schools.
High-performing groups are both problem seekers and problem solvers.
High-performing groups operate with high expectations and positive intentions as central assumptions. Within these groups, it is safe to display both high competence and vulnerability. In less-productive groups, members fear attack or reprisal for things they might do or say.
High-performing groups leave titles, seniority, and role authority at the door. On this level playing field, they seek a diverse blend of voices and protect space for all to contribute.
Analyzing data skillfully requires thoughtful process, emotional control, and mental focus. Working with data should be a learning experience.
… exploring and discovering require data teams of four or five members, with each team working with shared, visually vibrant data displays. Larger working groups and too much data at one time lead to overload and disengagement.
Data enthusiasts need to act as resources and refrain from dominating their groups and interpreting the data for them. The data shy need the confidence to ask what they fear might be obvious questions about the data or displays.
When exploring data, the question groups first need to ask is not, “What steps do we need to take?” but rather “What is causing these results?”
Simply because there is a correlation between events, behaviors, or results does not necessarily mean there is causality.
A ratio of approximately four to six participants to one large data display works to create a focal point. The small group size increases participation and captures individual energy.
Assumptions matter; they govern perceptions, reveal beliefs and values, and ultimately form our criteria for right or wrong. As a result, assumptions are the roots of any dissonance when we feel oppositional to others’ ideas.
Quotes from Others
“You’re entitled to your own opinion, but you’re not entitled to your own facts.” - U.S. Senator Daniel Moynihan
Organizations/schools working on answers
Gateways to Further Learning
Referenced books for purchase

The applicability of this book to education is ….

Resources